Memory management
The machines Basically targets have very little RAM - the unexpanded ZX81 has just 1K - so keeping track of where your program lives and what it writes to matters more than on a modern computer. The IDE gives you several tools for this: a live memory readout in the status bar, a colour-coded memory map of the whole machine, and a variable watcher. This page covers all three.
Memory in the status bar
The status bar always shows how full the machine's memory is, and it reads two different ways depending on whether a program is running.
- While you edit (emulator stopped) it shows the byte budget: the size of your tokenized program against the machine's documented free RAM - for example
842 bytes (13% of 16K budget). Keywords tokenize to single bytes and numeric literals carry an extra binary form, so this tracks the real cost of what you type. This is only an estimate of headroom - a running program's actual free space also depends on its variables and the display mode. - While a program runs or is paused it switches to the machine's actual RAM in use, read from the live emulator - for example
4,096 bytes used (25% of 16K).
The figure changes colour as memory fills up: it turns amber past about 80% and red past 95%, an early warning that you're running out of room on a small machine. Hovering the readout tells you which of the two modes it's currently showing.
The memory map
The memory map is a colour-coded picture of the whole machine's address space, from address zero at the top to the top of memory at the bottom. It shows where the ROM, the screen, the system workspace and your BASIC program each live - and it marks every address your program writes to.
Open it from the memory-map icon in the toolbar (next to the AI button); on a phone or in landscape, choose Memory map… from the ⋯ overflow menu instead. The map is only offered on machines whose layout the IDE describes, so the entry point is hidden for dialects that don't have one yet. It opens in the right-hand column, sharing that slot with the emulator preview and the AI assistant.
Reading the map
Each coloured band is a region of memory, grouped by what it's for: the machine ROM, the screen (display bitmap), the colour/attribute area, hardware buffers, the system workspace and variables, your BASIC program, and any reserved RAM above it. Every region is a distinct colour so you can see at a glance how the address space is carved up and how much of it your program has to share.
A colour always means the same thing, on every machine. ROM is the same colour on a ZX81 as on a Commodore 64, and so is your program area - so once you've read one machine's map, switching to another doesn't mean learning it again. Where a band opens into smaller regions as you zoom in, those appear as progressively deeper shades of the band's own colour: each is easy to tell from its neighbours, while the shared colour keeps showing which group they belong to.
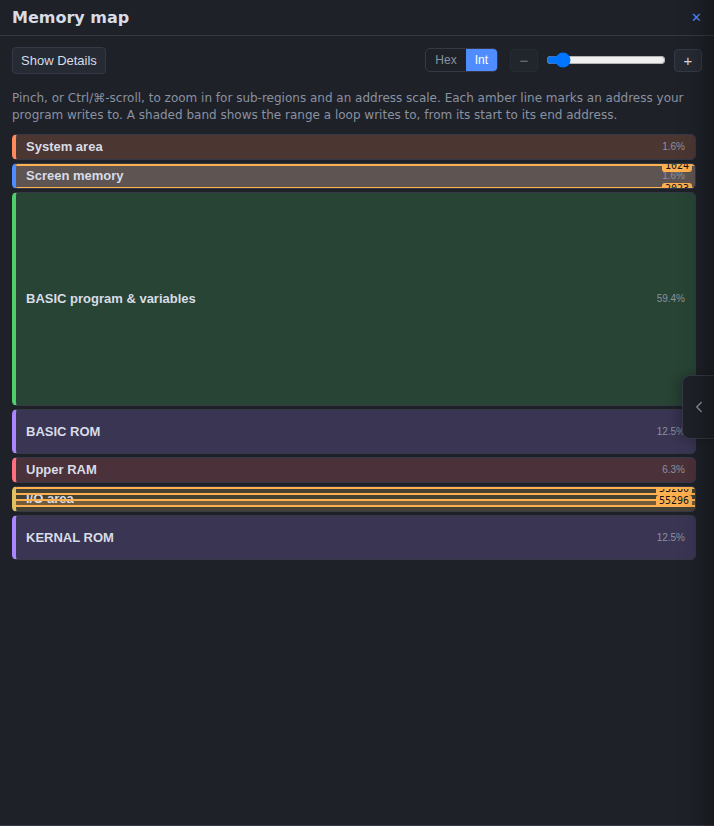
The map opens zoomed out, showing just the major groups with the percentage of memory each takes. Zoom in to reveal the sub-regions inside a group, an address scale down the side, and the exact addresses your program touches. Zoom with:
- a pinch gesture on a touch screen,
- Ctrl/⌘ + scroll with a mouse or trackpad, or
- the zoom slider and + / − buttons in the panel's controls.
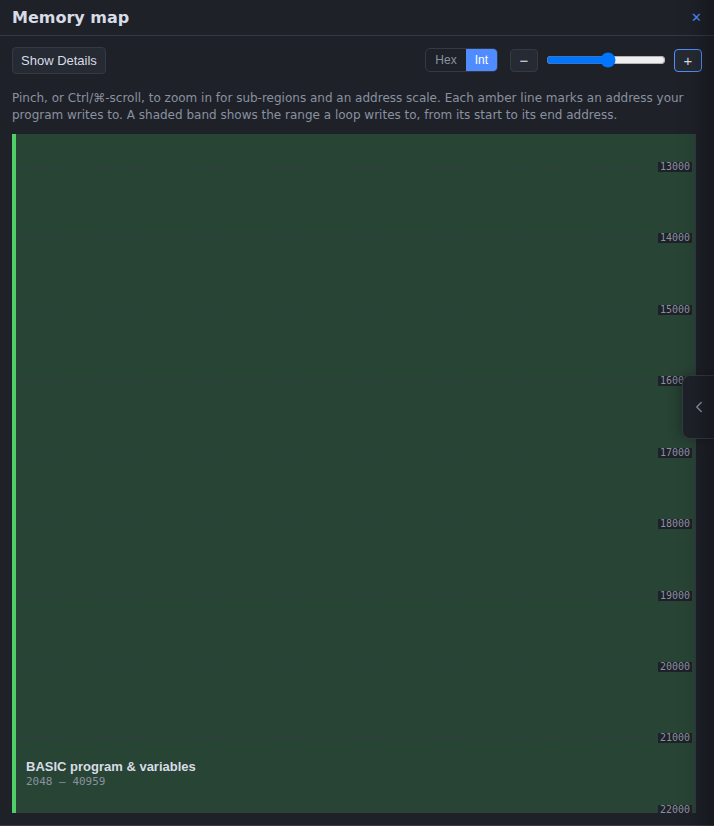
Addresses read out in either hex (&4000) or plain integers (16384) - switch with the Hex / Int toggle. Each machine opens in whichever notation is conventional for it (hex for the BBC and Atom, decimal for the Sinclair and Commodore machines).
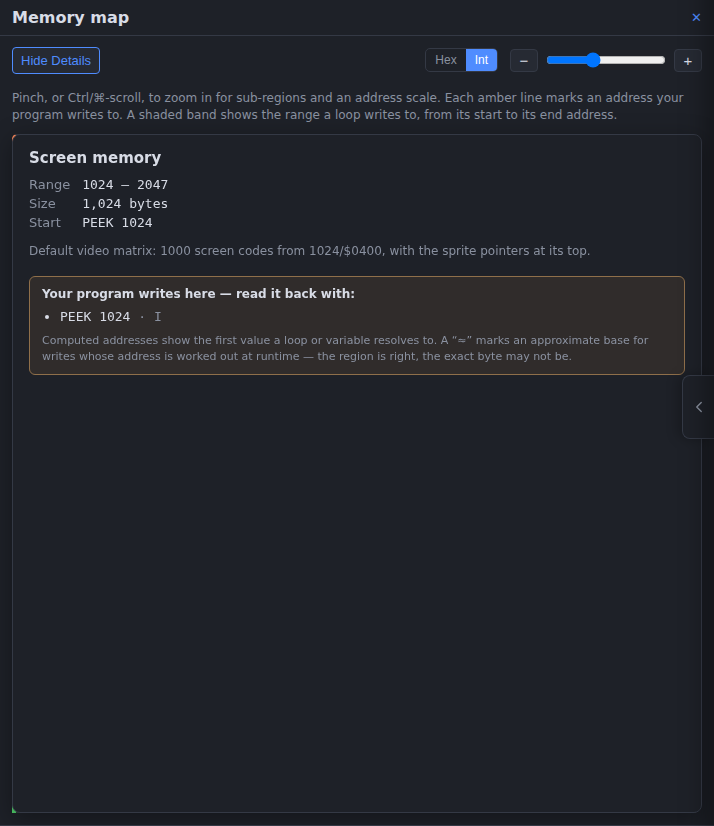
Turn on Show Details and click any region to see its exact range, its size in bytes, its start address (as the value you'd PEEK to read the first byte), a list of its sub-regions, and notes explaining what it holds.
POKE location markers
Every address your program writes to is drawn as a line at its position inside the region it lands in - so you can see exactly which part of memory each write touches. The map finds these by reading your source, not by running it, so the markers update as you type.
- Literal addresses (
POKE 16384,255) are placed exactly. - Computed addresses are resolved too: the map follows simple variable and
LET/FORassignments, soPOKE base+1,valand aPOKEinside a loop are placed at the address they first work out to. On machines with user-defined graphics,POKE USR "a",nis resolved to that graphic's address as well. - A loop that writes across a range of addresses is drawn as a shaded band from its start address to its end address, not just a single line, so you can see the whole span it fills.
- When an address depends on something the IDE can't pin down statically (a value read at runtime, say), the marker is shown as an approximate base, tagged with a ≈: the region is right but the exact byte may not be.
- If a write resolves to an address outside the machine's memory, it can't be drawn on the map, so it's called out in a warning at the top of the panel instead.
With Show Details on, selecting a region also lists the writes that land in it together with the PEEK you'd use to read each one back - a quick way to check a value your program stored.
The BBC and Atom have no POKE; they write memory with ? (byte) and ! (word) indirection, as ?&2000 = 255. The map understands those forms and marks them the same way.
Live activity monitoring
While a program is running with the map open, the map lights up the addresses the CPU is actually touching, frame by frame. Reads glow teal and writes glow coral, each fading away over about half a second, so you see a live trace of what the program is doing to memory - the screen region flickering as it's drawn, the stack working near the top of RAM, a stray write landing somewhere it shouldn't.
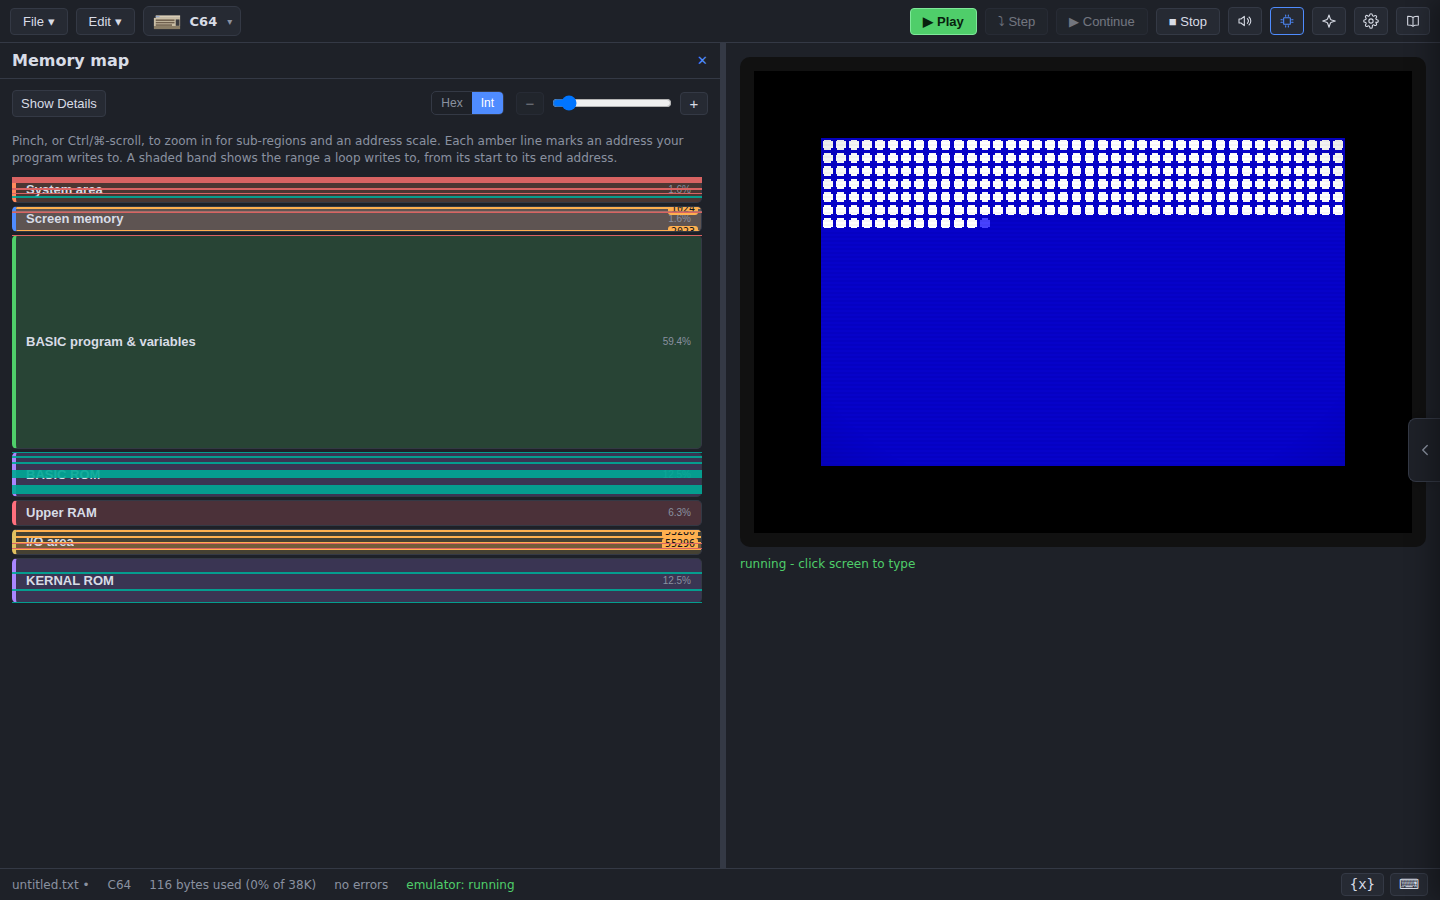
Activity is only recorded while the map is on screen, so it costs nothing when the panel is closed. Pair it with the POKE markers to confirm that a write you intended is really happening where you expected.
Comparing two machines' memory
Porting a program to another machine? The porting guide draws both machines' memory maps side by side, on one shared address scale, so a position in one is the same address in the other. With your program open, it marks the addresses your program writes to on both maps — where the program put them on the machine you're leaving, and where they would land on the machine you're moving to. That is how you spot a write aimed at one machine's system variables that would come down in the middle of another machine's BASIC program.
Reading a machine's map without opening it
Every machine's map is also in its language reference, in the Memory section of that machine's hardware page — the C64, VIC-20 and PET, the BBC Micro and Master, and so on. Same map, same controls, no program needed: useful for looking up where a machine keeps its screen or its system variables before you write the POKE.
Watching variables
The variable watcher is a live table of your program's BASIC variables. Show or hide it with the {x} button in the status bar; the table appears below the emulator screen and lists each variable's name, type (number, string, num array, or str array), and current value. Click any value to open a snapshot of it - useful for a long string or array that doesn't fit the table.
While the program runs the watcher refreshes several times a second, so you can watch values change; when the program is paused at a breakpoint the values hold steady. Variable watching relies on the emulator being able to read the machine's variable area, so it's offered only on the machines that support it.
For how the watcher pairs with breakpoints and stepping to track down a bug, see Testing your code.